 Benthic Photo Survey
About
What Does it Do?
BPS helps you process photo transect data (photos, GPS track, and depth log) into a point shapefile containing habitat and substrate attributes that you assign to each photo using the BPS interface. You can do this without BPS but it will take you a lot longer. Without BPS, you’ll have to use several different pieces of software and do hours of mind numbing manual data entry. Previous studies have found this cost in terms of time and money to be a major drawback to the use of photo transects1.
This is just a brief introduction and overview to the main features of BPS. For a more complete look, please look at the BPS Documentation.
Step 1: Field Work
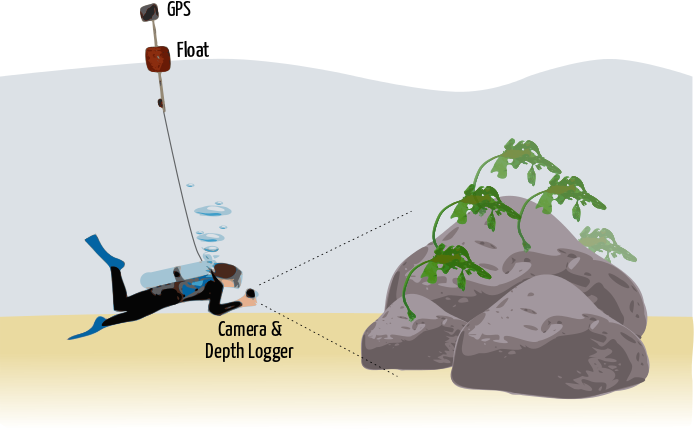
BPS works by using the photo acquisition times to find positions and depths in the GPS and (optionally) Depth Logger records. There are number of different ways to use BPS (SCUBA, breath hold diving, drop camera, etc). The only requirement for BPS to work is that the camera be located directly below the GPS and that the depth logger (if being used) is near the seafloor when each photo is taken. The diagram below illustrates the equipment set up for use with SCUBA. Photo transect procedures have been well documented in previous publications 1,2.
Step 2: Using BPS
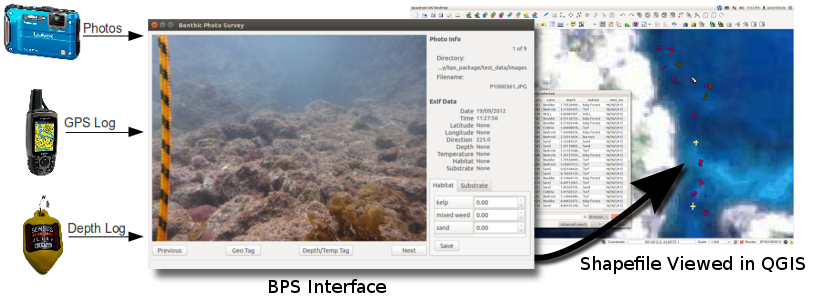
Once you’re done with your field work, you load the logs from your GPS and (optionally) depth logger into BPS. BPS can then write position and depth information into the EXIF portion of each photo. Using the BPS interface you can then quickly page through your photos and label each photo with a substrate category and proportions of each habitat. This substrate and habitat information is also written into the EXIF portion of each photo. You can customize the habitat and substrate categories in the BPS preference menu.
The Output
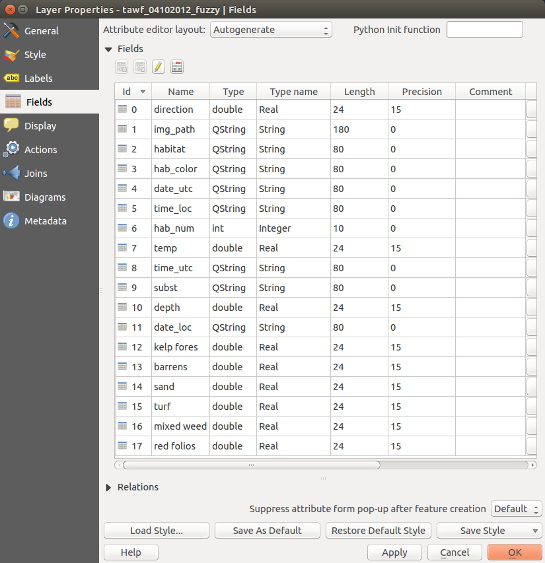
Once you have fully attributed your photos with BPS, you an export a point shapefile for use in GIS software such as QGIS. The point locations are created from the photo locations and each point is attributed with substrate, habitat proportions for each of the habitats, the dominant habitat type, depth, and a number of other related attributes. Below is a list of data fields from a BPS generated shapefile as displayed in QGIS.
Who Built BPS?
BPS was developed by Jared Kibele at the University of Auckland’s Leigh Marine Laboratory as part of his PhD project (funded by Auckland Council and with an imagery grant from DigitalGlobe Foundation). Please contact Jared if you have any questions or comments about BPS. He spent a lot of time on BPS and would be thrilled to know that someone (outside Leigh Marine Lab) is using it.
References
-
Roelfsema, C., Phinn, S., 2010. Integrating field data with high spatial resolution multispectral satellite imagery for calibration and validation of coral reef benthic community maps. J. Appl. Remote Sens 4, 043527–043527. doi:10.1117/1.3430107 ↩ ↩2
-
Roelfsema, C., Phinn, S.R., 2009. A Manual for Conducting Georeferenced Photo Transects Surveys to Assess the Benthos of Coral Reef and Seagrass Habitats version 3.0. ↩